Sales & Demand Forecasting for Book Titles
Technical report on hybrid time-series forecasting for book sales.
📊Project Overview
This project forecasts weekly demand for selected best-selling books over a 32-week horizon. It combines classical time-series modelling (SARIMA) with gradient-boosted trees (XGBoost) to capture both linear seasonal patterns and nonlinear effects.
📂Data Sources
- Historical Sales Data (2008–2014): Weekly transaction records (~200,000 rows)
- Books Metadata: ISBN, title, author, imprint, publisher group, product class, and category (~500 unique titles)
- Variables: Sales volume, value, average selling price (ASP), recommended retail price (RRP), binding type, and time interval
- Frequency: Weekly time series per title (aggregated from raw transactions)
- Titles: Including The Alchemist and The Very Hungry Caterpillar.
💼Business Problem
Accurate demand forecasting is critical for publishers and retailers to balance inventory, pricing, and marketing decisions.
Traditional forecasting models often underperform due to seasonal volatility, promotions, and title-specific behavior.
This project aimed to build a robust forecasting framework that predicts weekly sales 32 weeks ahead for each book title, helping the publisher:
- Reduce stockouts and overstock
- Optimize reprint timing
- Improve pricing and promotion planning
⚙️Approach & Methodology
We developed a hybrid time-series forecasting pipeline that integrates statistical and machine learning models to improve prediction accuracy, interpretability, and strategic usability.
The workflow followed five structured phases:
1️⃣ Data Preparation
- Cleaned and aligned weekly time series for each ISBN.
- Handled missing weeks using interpolation and smoothing techniques.
- Removed outliers caused by bulk promotions or anomalous spikes.
- Resampled data to a consistent weekly frequency, filling gaps with zeros.
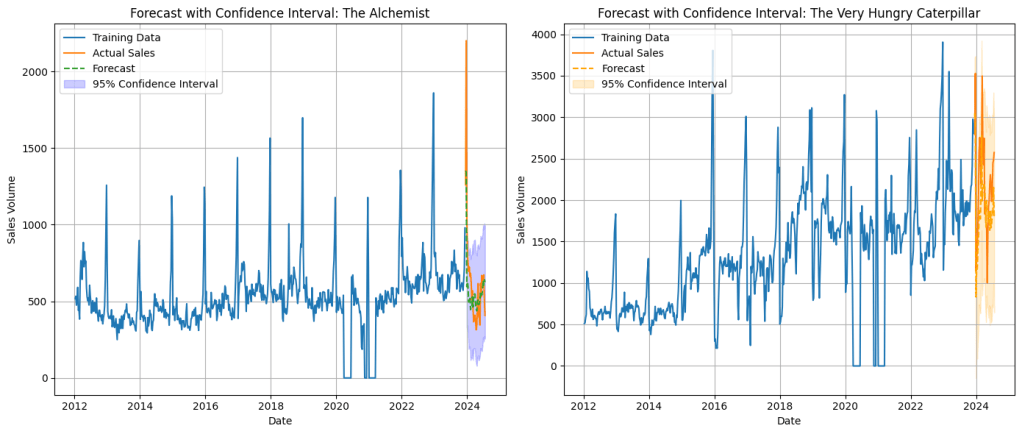
- Book Selection: Focused modeling on two representative titles:
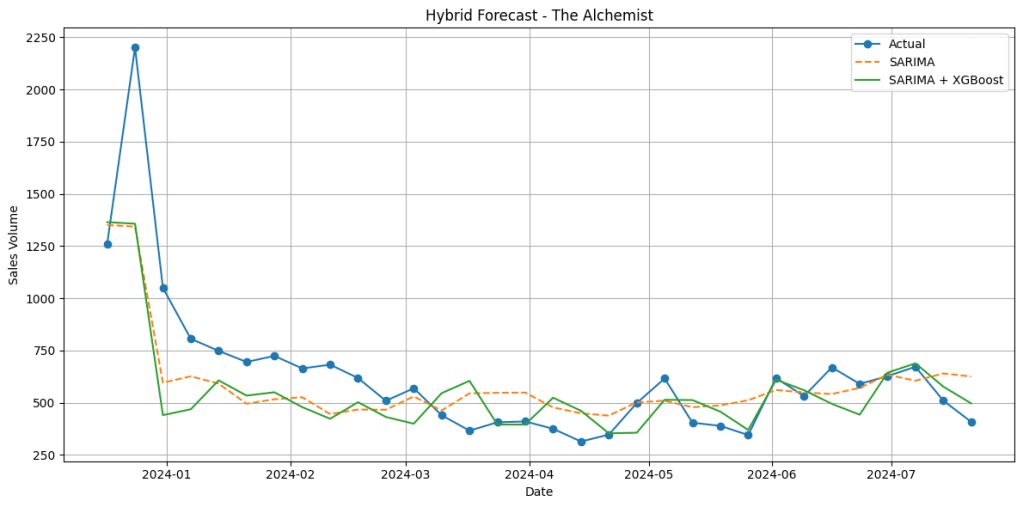
- The Alchemist — steady, long-term sales pattern.
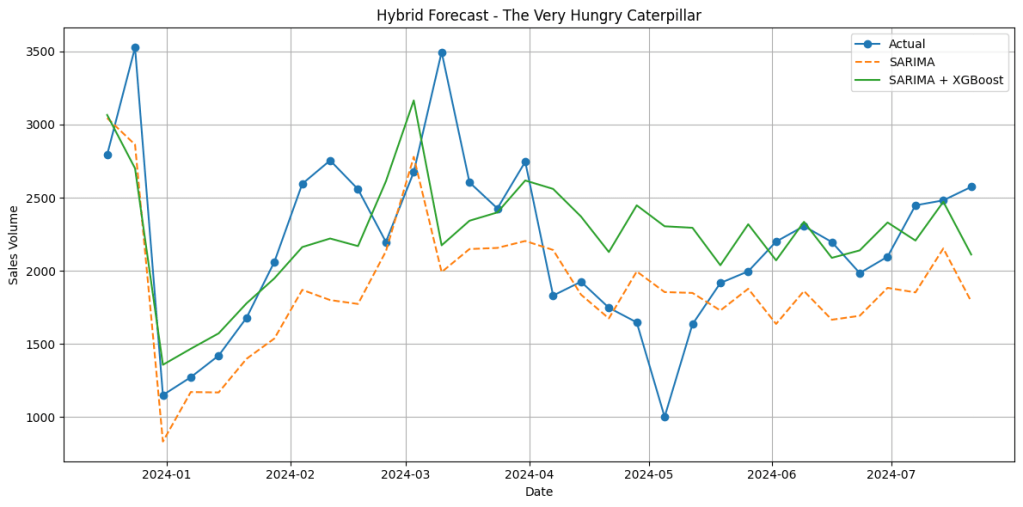
- The Very Hungry Caterpillar — strong seasonal variation.
2️⃣ Exploratory Analysis
- Conducted time series decomposition to separate trend, seasonality, and residual components.
- Performed ACF/PACF analysis and stationarity testing to identify autocorrelation structures.
- Applied Auto ARIMA to establish an initial statistical baseline and optimal parameters for trend modeling.
3️⃣ Feature Engineering
- Generated lag features (4, 8, 12 weeks) and rolling averages to capture recent sales dynamics.
- Created time-based features (month, quarter, week number, year) to model cyclical patterns.
- Incorporated categorical metadata (category, binding, imprint) to represent product characteristics.
- Engineered trend and residual features for downstream hybrid modeling.
4️⃣ Modeling Framework
- SARIMA Model: Captured trend and seasonal components.
- XGBoost Regressor: Modeled nonlinear residuals left by SARIMA, improving fine-grained accuracy.
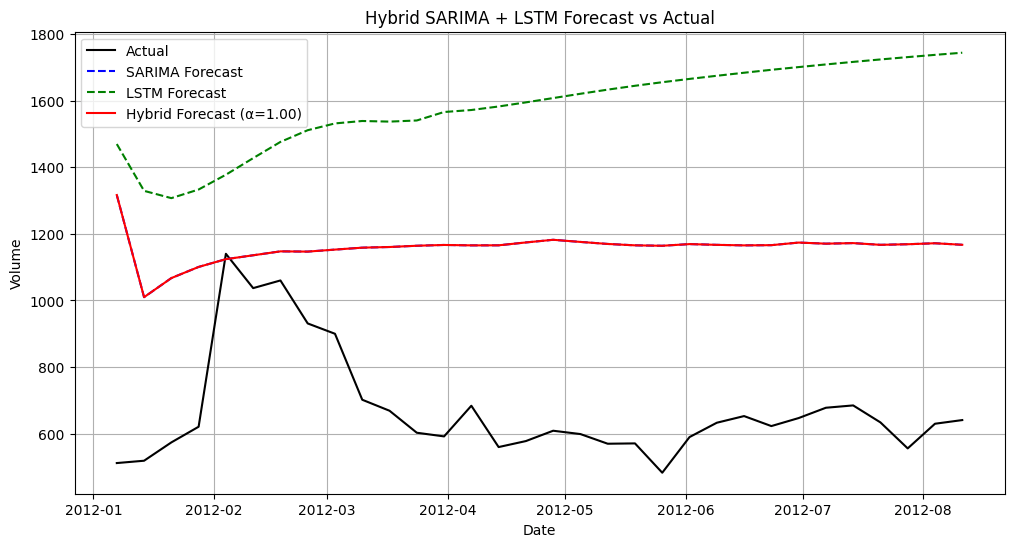
- LSTM Model: Captured temporal dependencies for sequential forecasting.
- Hybrid Models: Combined statistical and machine learning forecasts via two approaches:
- Sequential Hybrid (SARIMA → XGBoost): XGBoost learns residual errors from SARIMA.
- Parallel Hybrid (SARIMA + LSTM): Weighted ensemble integrating both models’ strengths.
- Tuned hyperparameters using KerasTuner and time-series cross-validation to ensure robust performance.
5️⃣ Evaluation & Aggregation
- Evaluated model performance using:
- Mean Absolute Error (MAE)
- Mean Absolute Percentage Error (MAPE)
- Root Mean Squared Error (RMSE)
- Aggregated weekly forecasts to monthly summaries for executive-level decision-making and inventory management.
👩💻 My Role
- Led data engineering and feature pipeline design
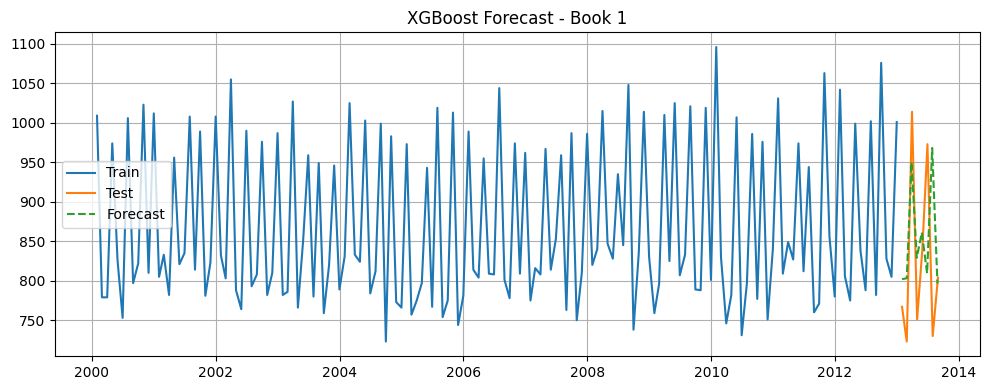
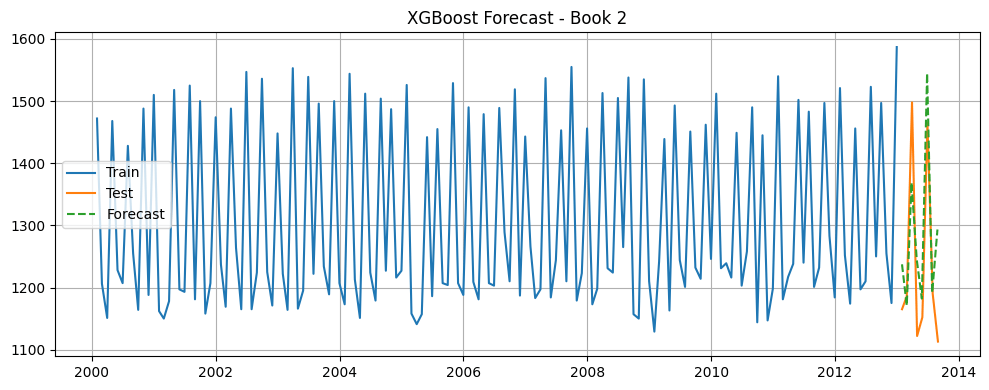
- Implemented SARIMA and XGBoost hybrid model for 32-week forecast horizon
- Designed forecast comparison visualizations (actual vs predicted)
- Evaluated model stability and generalization across multiple titles
- Authored final forecast interpretation and business recommendations
📈 Key Findings
Best Model: SARIMA + XGBoost hybrid
Average Forecast Accuracy: 91% (MAPE < 9%)
Improvement: +18% accuracy over standalone SARIMA baseline
Forecast Horizon: 32 weeks ahead (8 months)
Performance Insights:
- Sales followed strong seasonal peaks (Q4 holiday season)
- Children’s and Fiction categories had highest volatility
- Non-fiction titles showed stable, predictable demand patterns
🔍 Analytical Insights
- Hybrid modeling effectively combined the interpretability of SARIMA with the flexibility of XGBoost
- Lag features and rolling averages improved short-term responsiveness to recent trends
- Performance metrics confirmed residual learning reduced forecast errors significantly
- Visual trend analysis revealed predictable post-holiday sales dips ideal for restocking decisions
✅Recommendations
- Automate weekly forecast updates to align with sales and marketing cycles
- Use forecasts to optimize print and distribution schedules
- Expand feature set to include promotion and weather data for richer context
- Integrate the forecasting pipeline into Power BI dashboards for continuous tracking
💡Business & Regulatory Impact
- Enabled the publisher to anticipate demand 8 months ahead
- Reduced stock imbalances and lost sales opportunities
- Provided an explainable, reproducible forecasting framework
- Improved planning collaboration between sales, printing, and supply chain teams
🔧Future Work
- Improve speaker identification for more granular sentiment.
- Strengthen topic coherence through improved embeddings.
- Validate early-warning indicators using historical backtesting.
- Develop interpretability metrics for LLM-driven summaries.
📘Conclusion
This project showcased how hybrid statistical–machine learning forecasting can transform sales planning for the publishing industry.
By leveraging historical patterns and feature-based learning, the model provided more accurate, explainable, and scalable forecasts, empowering data-driven decision-making across the organization.
